

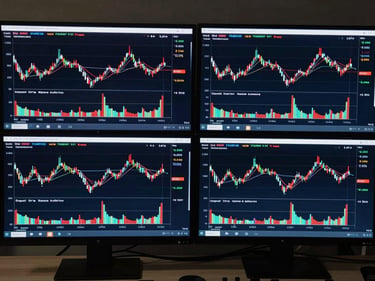
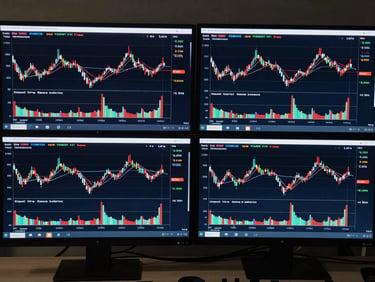
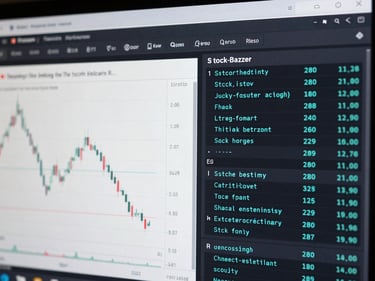
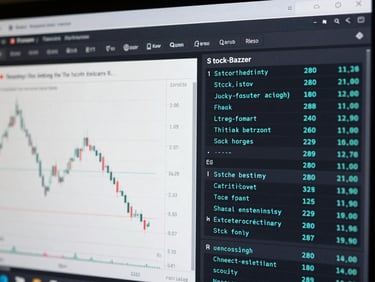
Four Pillars of Signal Clarity
Smart Money Flow
Buy / Sell Signal Overlays
Multi-Asset Coverage
Native TradingView Integration
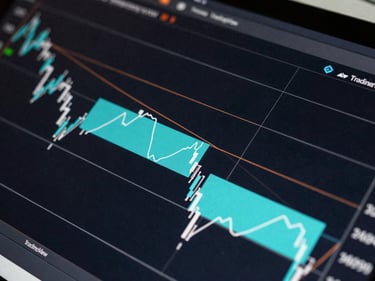
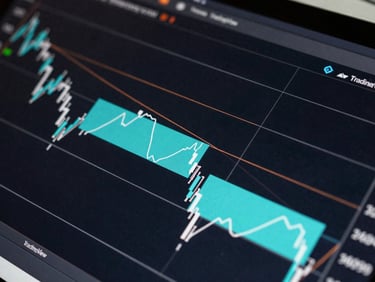
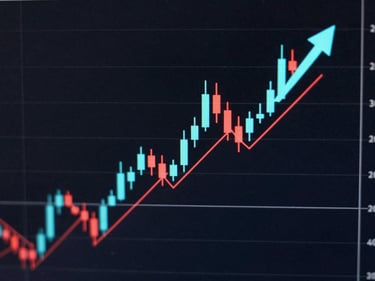
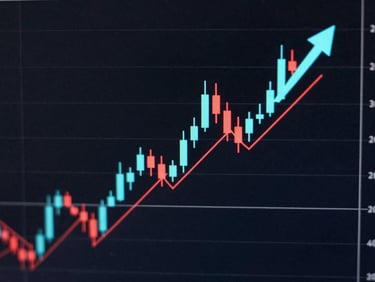
Rule-based entry and exit markers rendered directly on price. No interpretation required — the signal fires or it doesn't, with back-tested frequency data attached.
Identifies institutional order blocks and liquidity sweeps before price confirms. You see where smart money positioned, not where it ended up.
Loads directly into TradingView as a published script. No new platform, no API keys, no setup friction — active in under two minutes.
Identical signal logic across equities, options, crypto, and forex. One framework, four markets — consistency is the point.
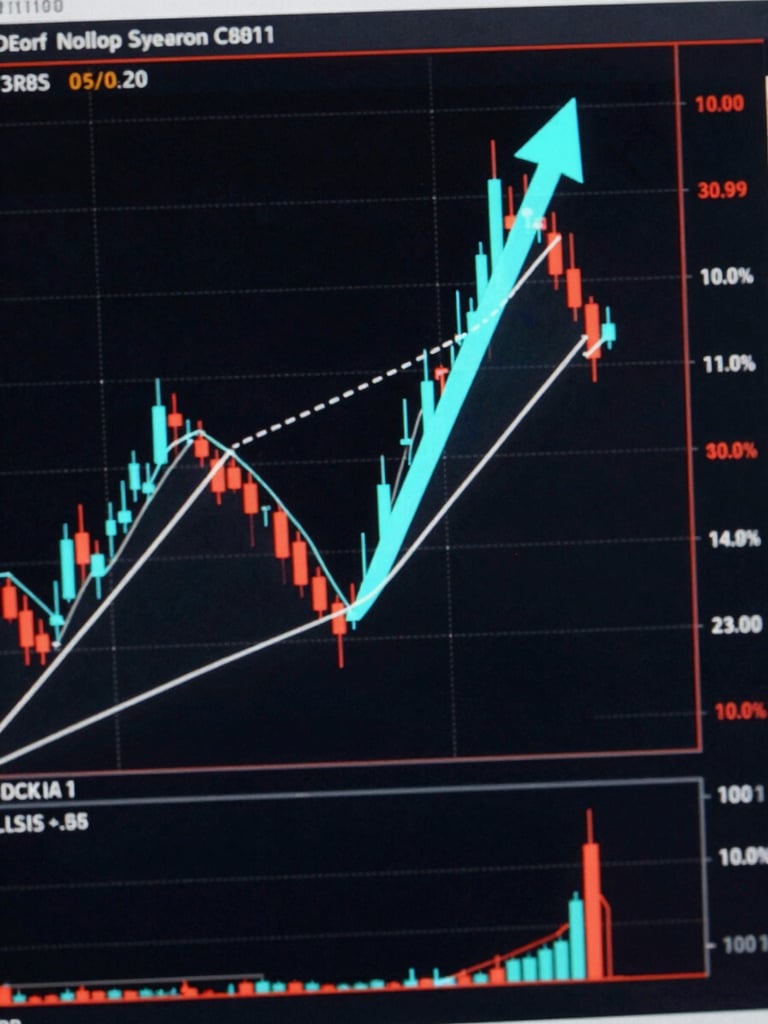
Every Signal Has a Defined Rule Set
Stock-Bazaar signals fire when institutional order block confluence, momentum shift, and volume confirmation align simultaneously. Three conditions. No exceptions.
Back-tested across 36 months of tick data on equities and crypto. Signal frequency, win rate, and average risk-reward are published inside the dashboard — not in a PDF buried in a welcome email.
Repeatable Logic. Consistent Signals. Live Now.
Professional traders don't need more indicators. They need fewer, better ones. Choose a membership tier and activate your dashboard today.
Stock-Bazaar
The market doesn't care about confidence. It cares about consistency.
Navigate
Home
Indicators
Pricing
Education
Connect
support@stock-bazaar.com
Telegram & Discord community included with all plans
Live market support during US & Asian sessions
(C) 2026 Stock-Bazaar-Repeatable logic. Real-time proof. Every session.
Signal clarity — no astrology